Original Reality Theory
Aa
2 Before Explaining the Theory / 2.4 Calibrating How We See: Perspective and Context
2.4.2 Calibrating Context
A journey that changes shape
So far, we have changed how we compare quantities. Now we will also change how we represent a movement. Before following our airplane, however, it is worth looking at a technique that science communication has long used: changing proportions to make relationships visible that would disappear if everything were drawn to its actual scale.
Why do we change the proportions?
A familiar example is the representation of the solar system. In schoolbooks, museums, and science communication materials, the Sun and planets often appear side by side, with their sizes, distances, and positions adjusted so that each can be recognized. This exercise did not invent that approach: it is a widely used teaching choice that makes the whole system easier to understand.
Look at the two halves of the image below. In the first, we immediately recognize Mercury, Venus, Earth, Mars, and the more distant planets because their sizes and separations have been adapted. In the second, the attempt to preserve the distances more closely makes the tiny marks representing the planets much harder to see; the image therefore uses guide lines and enlarged circles to show where they are and what they look like.
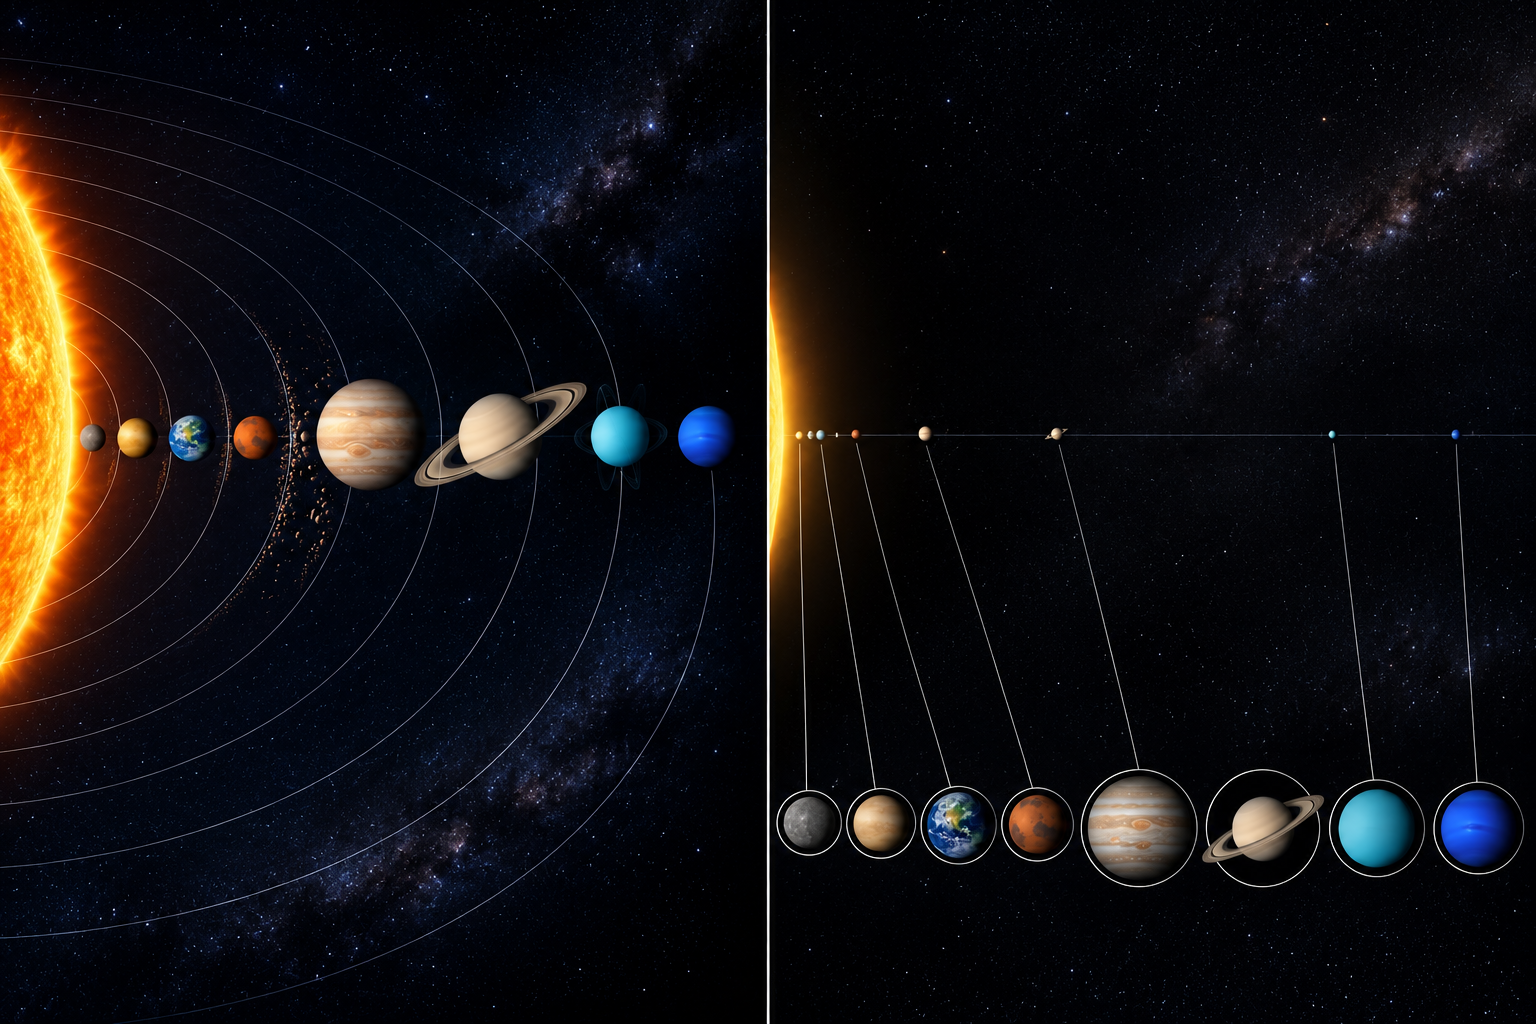
We can make the contrast more concrete with a mental image. If the Sun were an orange about 8 centimeters in diameter, Earth would be a point less than 1 millimeter across, about 8.6 meters away. Jupiter would be approximately 8 millimeters across and about 45 meters away. Neptune, less than 3 millimeters across, would be more than 250 meters away. When we try to fit everything on the same sheet of paper, preserving the distances while still showing what the planets look like becomes practically impossible.
A representation does not have to reproduce all the properties of a phenomenon at once to be useful. It does, however, need to make clear what it preserved and what it adapted. In the next images, we will do something similar: show the same journey within progressively broader frames of reference, first to understand the change in viewpoint and then to make movements perceptible that would disappear if we kept all the physical scales literal.
One journey, different frames of reference
Let us apply the same technique to an airplane’s path. Figure 7, immediately below this exercise, brings together five panels showing a single journey. Read one stage at a time, go to the indicated panel, and return to the highlighted marker to continue. At the end, look at all five together and compare the perspectives.
Imagine an airplane traveling for twelve hours between two distant points on Earth, which we will call A and B. For the passenger, the journey might be drawn as a simple arrow: it leaves A, moves forward, and arrives at B. In the seat, the passenger barely feels the enormous displacement. With the window shade closed and attention confined to the cabin, the cup stays on the tray table and the people seem almost motionless. All these observations can be consistent with the reference being used.
The pilot and the navigation systems need a different description. Earth is approximately spherical; on its surface, the shortest path between two points ideally follows an arc of a great circle. On certain flat maps, that arc appears as a curve that would surprise someone who imagined a straight line. A real flight, of course, also depends on winds, weather, air traffic, and operational decisions. The important point is not that the passenger is wrong and the pilot is right: it is that a simplified arrow, a route on the globe, and a line on a map are not the same representation.
↳ Figure 7 · panel 02 — Pilot. Notice how the route follows Earth’s curvature.
Now let us change the context again. In the representation tied to Earth’s surface, airports A and B maintain approximately fixed positions. But imagine that our drawing is attached to a coordinate system that does not rotate with Earth. During a twelve-hour journey, the planet completes approximately half a turn relative to the stars. Both airports move with the surface; the airplane moves relative to them while also sharing Earth’s rotation. The path drawn in this new frame of reference no longer coincides with the arc seen on the rotating globe.
↳ Figure 7 · panel 03 — Outside Earth. Observe the planet’s rotation while the flight takes place.
Let us widen the frame. Earth is not only rotating: it also travels in its orbit around the Sun at an average speed close to 30 kilometers per second. In twelve hours, its orbital movement amounts to a path of about 1.3 million kilometers. Both the departure and arrival airports have been carried along by that displacement. If we draw the journey in a frame of reference related to the Sun, we must include this movement. That does not mean the passenger bought a ticket to travel 1.3 million kilometers relative to the ground: the distance depends on the frame of reference adopted.
↳ Figure 7 · panel 04 — Outside the Solar System. Notice that Earth also moves around the Sun.
We can shift our reference even farther out. The solar system itself orbits the center of the Milky Way at a speed on the order of hundreds of kilometers per second. In twelve hours, the displacement corresponding to the solar system’s galactic motion is on the order of millions of kilometers. In this context, the airplane’s path incorporates movements that did not even appear in the earlier drawing. We cannot simply add speed or distance values as though they all pointed in the same direction; to represent the path rigorously, we must combine vector positions and velocities in a specified frame of reference.
Let us try one final mental exercise. Draw the journey once on a passenger’s sheet of paper, then on a globe, then in a frame of reference that does not rotate with Earth, then in the context of the orbit around the Sun, and finally in the context of the galaxy. In each drawing, ask: what was preserved? What began to move? Which points were considered fixed? What time and spatial scales are we working with?
Now look at all of Figure 7. The five panels show the same journey from A to B, but each broadens the context being considered. Compare them before continuing: what once seemed like a simple line now includes the movements of Earth and the solar system.
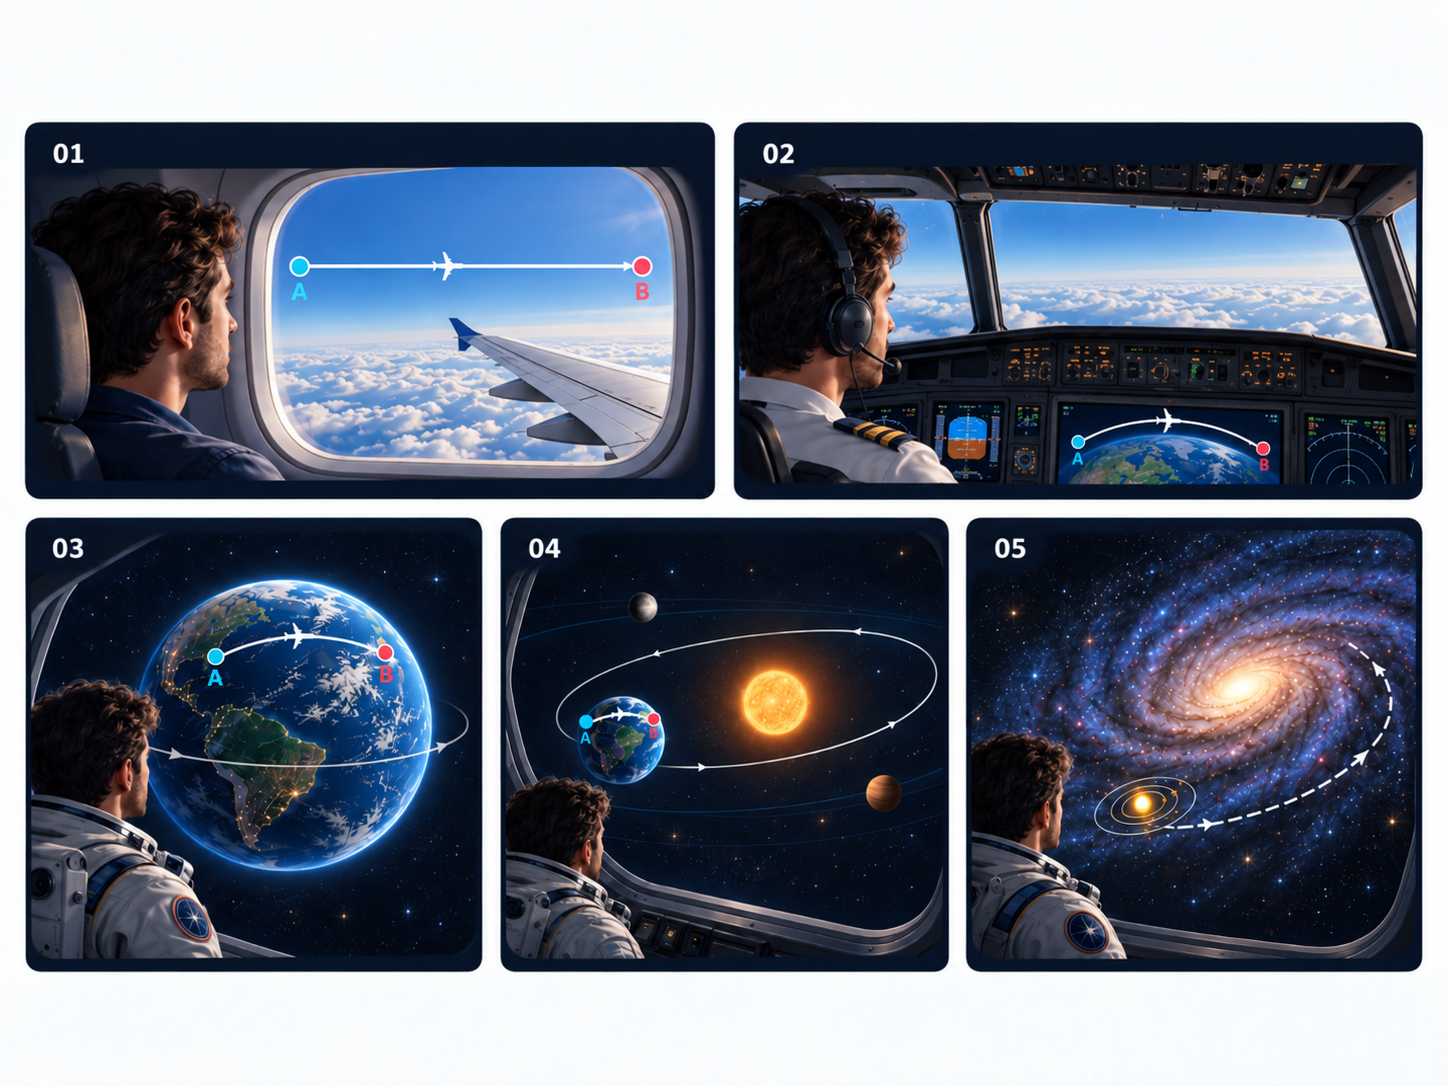
Notice the difference between the extremes: in panel 01, the arrow helps the passenger imagine the journey; in panel 05, the solar system’s movement greatly expands the context. The intermediate panels add one change at a time. In all of them, A and B indicate the departure and arrival of the same flight. Inside the cabin, the passenger remains almost motionless relative to the airplane itself.
In Figure 7, the teaching adaptation consists of simplifying the paths, enlarging the celestial bodies, and visually representing frames of reference that actually involve very different scales. The drawings are not calculated records of the airplane’s trail; they prepare us to understand what changes when the observer includes Earth’s rotation, its orbit around the Sun, and the solar system’s movement through the galaxy. In a twelve-hour flight, Earth rotates about half a turn relative to the stars, travels approximately 0.49° along its solar orbit, and covers only a tiny fraction of the galactic orbit. In the next figures, we will examine the trails and visualization factors more specifically.
The airplane made one journey. These were not five different journeys. Yet each representation selected different relationships within that same event. The purpose of calibrating context is not to declare all descriptions equivalent or equally useful. It is to recognize that even an apparently simple line can depend on movements and relationships the observer had left outside the frame.
When someone else’s explanation seems strange, it is worth asking a question before disagreeing: are we describing the same event from the same context? Sometimes disagreement begins because one person is looking only at the airplane while the other has also included the planet, the Sun, and the galaxy.
From separate movement to an integrated trail
Imagine three tiny points of light photographed over twelve hours. The blue point is at the departure airport (A); the red one is at the arrival airport (B); the white one follows the airplane. In a long-exposure photograph, each point leaves a line. Our first impulse is to draw only the white line, from A to B. But both airports are also moving: they rotate with Earth and share its movements through space.
The next image separates the perspectives to make them easier to read. Begin with the passenger and pilot panels. Then observe what happens when the viewpoint stops moving with Earth’s surface. In the last panels, blue, red, and white leave trails at the same time: we changed the frame of reference, not the journey.
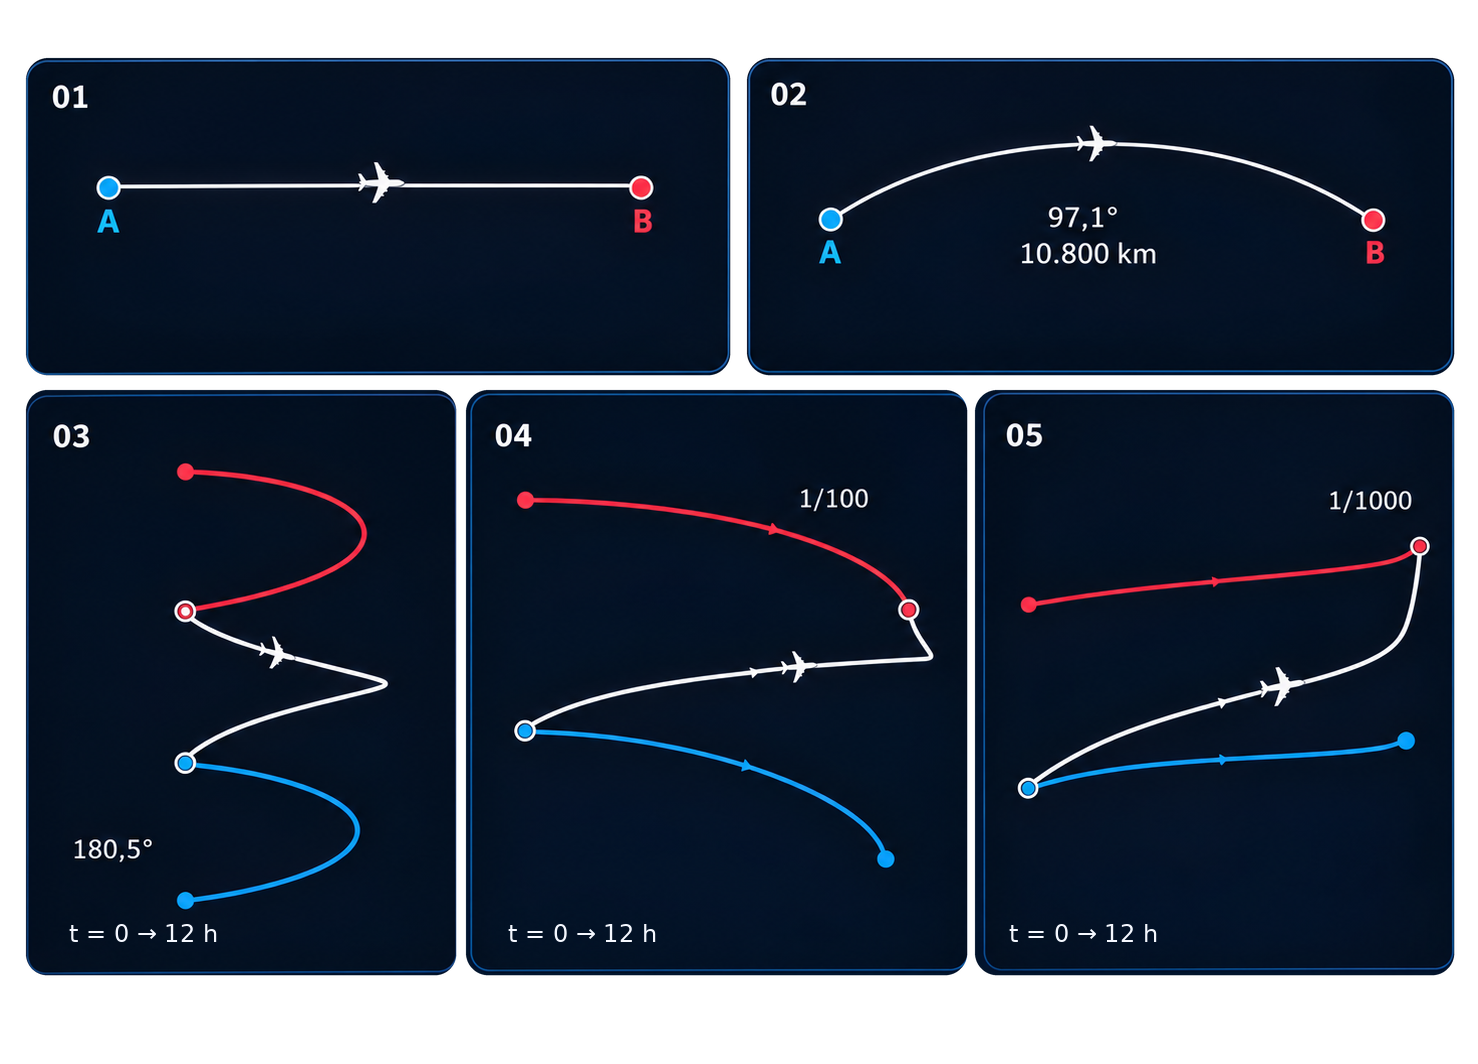
To read this image without formulas, imagine three luminous pens on a rotating sheet: the blue one is attached to airport A; the red one, to airport B; the white one moves across the sheet from A to B. Now imagine this rotating sheet being carried by another platform, which is also moving. Each pen’s line now records both its own movement and the platform’s. This is the change in reference the panels try to make visible.
Figure 8 separates the effects to make them easier to understand. In the idealized twelve-hour example, an airplane traveling at 900 km/h covers 10,800 kilometers relative to the ground; Earth rotates about 180.5° relative to the stars, while its orbital and galactic displacements are much greater. For a mathematical comparison in which the smaller movements remain visible, we can keep rotation at 1× and reduce the orbital and galactic displacements to 1/100 and 1/1000, respectively. These are visualization factors in a teaching model, not changes to actual distances or speeds.
In the next figure, we move away from separate panels. Imagine the three pens drawing at the same time on all these moving platforms. The result is presented as a single long-exposure record: blue, red, and white, each accumulating its path. To keep smaller details from disappearing in the presence of larger ones, this final image uses a new visual normalization.
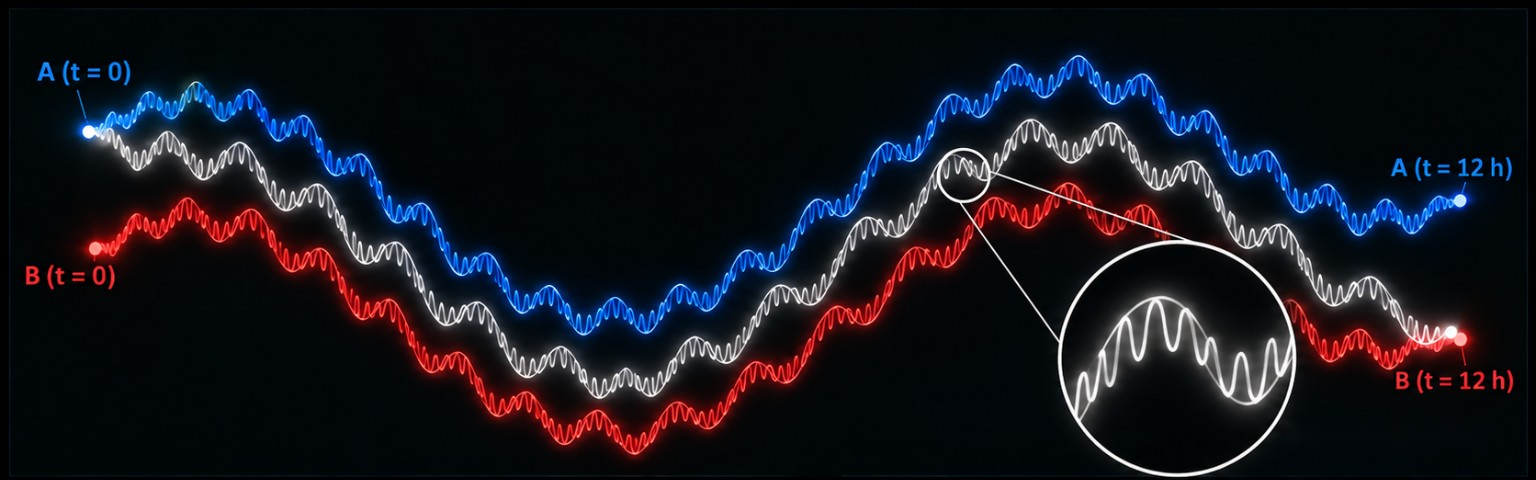
Start with the colors, not the formulas. The blue line records where the departure airport was at each moment; the red line does the same for the arrival airport; the white line follows the airplane. The airplane leaves A at the beginning and reaches B at the end, but A and B did not remain motionless during the journey. The larger curve suggests the movement of the whole; intermediate variations and small undulations appear along it, making the idea of smaller movements participating in larger ones intuitive. The magnifying lens only reveals part of the white trail; it does not show another path.
The teaching adaptation is crucial: the visual scale has been changed so that all layers remain perceptible. In Figure 9, galactic motion was used as the baseline (1×), while the orbital, rotational, and local-displacement components were represented with illustrative weights of 8×, 500×, and 900×. These are drawing coefficients, different from those in Figure 8; they do not mean that Earth or the airplane accelerated. Nor does each undulation correspond to an actual revolution: in twelve hours, Earth travels less than half a degree along its solar orbit and a tiny fraction of the galactic orbit. The composition illustrates the idea of superposition, not a literal astronomical reconstruction.
For a mathematical reading, the paths can be described by position functions over time and a vector sum of the movement components in the chosen frame of reference. The numerical details and the scope of the visualization factors are recorded in the technical notes; they need not interrupt the intuitive reading.
What changed during the comparisons and the journey?
If you returned to some answers and changed your mind, ask yourself what actually changed. Did the Sun change its mass? Did the brain start consuming more energy? Did the lightning get hotter? Did the proton gain pressure because we studied it? No. What changed were the distinctions we made: whole and part, mass and volume, energy and power, surface and core, duration and instant, physical behavior and functional organization.
Something similar happened in the airplane exercise. The passenger observes a journey from A to B; the pilot takes Earth’s curvature into account; other frames of reference add the planet’s rotation and the movements of Earth and the solar system. Even the airports, which seemed motionless, begin to leave trails. These were not five different journeys: we broadened the context, and other relationships became visible.
A comparison can be surprising and rigorous at the same time. To achieve that, we need to state the criterion, respect the units, and recognize the representation’s limits. That is why we enlarged planets in the solar system figure and adjusted scales in the airplane images: not to change the phenomena, but to see relationships that would almost disappear in a literal drawing.
This also does not mean that every perspective serves every question equally well. The Sun’s total power answers one question; power per kilogram answers another. A route drawn on Earth’s surface is useful for navigation; a broader frame of reference shows movements that route does not represent. The appropriate description depends on what we want to understand.
A physicist, astronomer, or other specialist may read these pages without finding anything new in their field. They may consider the comparisons elementary or of little use to their work. And given the question that usually guides their research, they may be right. These exercises do not seek to add technical knowledge to each discipline’s repertoire: they seek to make visible how the choice of a measuring stick, scale, or context changes the relationships we can perceive.
This distinction becomes more important as knowledge grows. A researcher can achieve great depth in one specialty without following all other fields with equal mastery, including those within the same discipline. Benjamin Jones (2009) examined the growing burden of knowledge required for innovation and its relationship to specialization; Wuchty, Jones, and Uzzi (2007) documented the expansion of teamwork in scientific production. This does not mean specialists are doomed to lose sight of the broader picture, but that building an overall view has come to require a deliberate, often collective effort.
This effort is familiar to science. The U.S. National Academies (2005) describe interdisciplinary research as the integration of information, methods, and perspectives from different fields to investigate problems that go beyond the boundaries of a single discipline. Uzzi and colleagues (2013), analyzing millions of articles, found an association between high-impact work and predominantly conventional combinations of knowledge that also incorporated unusual connections. These studies do not prove ORT or guarantee that bringing fields together will produce discoveries; they do show, however, that investigating relationships among bodies of knowledge is part of science’s own strategies.
We can imagine specialties as drawers. Each holds methods, definitions, and findings developed with great rigor. ORT seeks to open more than one at a time: not to mix their contents indiscriminately, but to investigate possible connections, patterns, and unifying perspectives among findings from different fields. Finding a similarity does not amount to demonstrating an identity; it may, however, be the beginning of a new question.
If one of these questions develops into a promising hypothesis, it will need to return to the relevant disciplines, with their methods of verification and their limits. It is within this circulation—from specialized findings to a broader map, and from that map back to new investigations—that ORT locates part of its proposal. Knowledge produced within the specialties remains the foundation; the attempt to connect it may, in turn, suggest paths for those specialties to advance.
Keep two questions in mind for the next pages: what measuring stick was used? And what was left outside the frame? When something seems obvious or absurd, first examine the comparison and context supporting it. In the first exercises, we changed the measuring stick; in the journey, we widened the frame. The Sun, the brain, and the airplane did not change because of that. Our way of observing relationships changed—and that is where a broader understanding can begin.
The entire theory on a single pageContinuous reading for people and AI tools.